When it comes to performance developers are limited with a choice of a suitable tool for measuring it. For PHP programmers there is a good one - Pinba, and since there is no much articles about it in English I decided to write one.
Overview
Pinba is a MySQL pluggable storage engine that acts as a realtime monitoring/statistics server for PHP using MySQL as a read-only interface. It collects data sent by PHP extension which generates a data packet on request shutdown and sends it over UDP. Using UDP protocol means there is no need to establish connection and allows not to affect performance of PHP scripts on production servers.
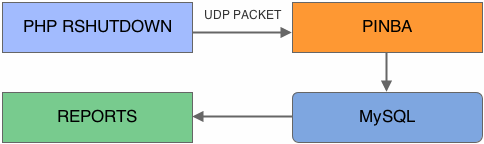
Pinba accumulates data in a set of read-only MySQL tables which are of two types:
- raw data tables; using these tables makes it possible to generate custom reports, but keep in mind that accessing the raw data is relatively slow for there may be a great number of records with no indexes except primary keys;
- reports; already aggregated data, updates on-the-fly as new request data arrives.
And the most valuable in my opinion part of Pinba is the ability to measure particular parts of code using timers with arbitrary tags. More about them later. The Pinba working stack consists of two parts: Pinba engine and PHP extension. I forgot to mention I’m working on Mac OS X 10.8.2.
Pinba engine
Pinba engine requires at least 5.1 version of MySQL (both sources and installation) since it’s the first version to support pluggable storage engine. Among other requirements Google Protocol Buffers and libevent (chances are it is already installed in your system). You can use Hoard memory allocator as an option to reduce memory consumption, but I won’t cover this option in this tutorial.
So, let’s start. Get and install Google Protocol Buffers.
$ cd /tmp
$ wget http://protobuf.googlecode.com/files/protobuf-2.5.0.tar.bz2
$ tar -xjf protobuf-2.5.0.tar.bz2
$ cd protobuf-2.5.0
$ ./configure --prefix=/usr/local
$ make
$ sudo make install
You’ll need MySQL sources in order to build Pinba engine. Notice that I had MySQL 5.5.28 installed on my machine and I got errors during engine installation. Finally I just upgraded to 5.6.10. More about it here. Pay attention to -DBUILD_CONFIG=mysql_release option (read here).
$ cd /tmp
$ wget -O mysql-5.6.10.tar.gz \
http://dev.mysql.com/get/Downloads/MySQL-5.6/mysql-5.6.10.tar.gz/from/http://cdn.mysql.com/
$ tar -xjf mysql-5.6.10.tar.gz
$ cd mysql-5.6.10
$ cmake -DBUILD_CONFIG=mysql_release
$ cd include && make
For building Pinba engine you’ll also need libevent and judy. I used brew to install them.
$ brew install libevent
$ brew install judy
Finally, get and install Pinba engine.
$ cd /tmp
$ wget http://pinba.org/files/pinba_engine-1.0.0.tar.gz
$ tar -xjf pinba_engine-1.0.0.tar.gz
$ cd pinba_engine-1.0.0
$ ./configure \
--libdir=/usr/local/mysql/lib/plugin \
--with-protobuf=/usr/local \
--with-mysql=/tmp/mysql-5.6.10 \
--with-event=/usr/local/Cellar/libevent/2.0.21 \
--with-judy=/usr/local/Cellar/judy/1.0.5
$ make
$ sudo make install
After that make sure you’ve got libpinba_engine.so in /usr/local/mysql/lib/plugin. Now that you have the plugin you need to enable it in MySQL.
# login to MySQL and install plugin
mysql > install plugin PINBA soname 'libpinba_engine.so';
# create a separate database
mysql > CREATE DATABASE pinba;
# create default tables
$ mysql -D pinba < default_tables.sql
PHP extension
Now let’s build and install PHP extension. It requires previously installed Google Protocol Buffers and PHP development package.
$ cd /tmp
$ git clone git://github.com/tony2001/pinba_extension.git
$ cd pinba_extension
$ phpize
$ ./configure
$ make
$ sudo make install
Now enable the extension in php.ini by adding pinba.so and setting option pinba.enabled=1.
Configuration
Now as you have everything installed you may want to configure Pinba engine or PHP extension. I’m just fine with default options but port option. By default Pinba engine and PHP extension have 30002 port number in their configs, but I failed to gather any statistics with this configuration may be due to some permission problems. So I changed the default port to 50002 in my.cnf and php.ini:
# my.cnf in [mysqld] section
pinba_port = 50002
# php.ini
pinba.server = 127.0.0.1:50002
# dont't forget to restart Apache and MySQL
$ sudo apachectl reload
$ sudo /Library/StartupItems/MySQLCOM/MySQLCOM restart
If you are interested in more options here are official descriptions for engine and extension.
What now?
Running any PHP script, no matter CLI or via web server, causes PHP extension to send gathered statistics to Pinba engine. It accumulates in a set of MySQL tables which you can use to build any kind of reports. By the way, developers already made some work for us and created basic report tables. These tables have names starting with report_. Here I will not focus on detailed description of each table and the data it stores for it is rather straitforward. For any explanation you’d better follow official documentation.
The real power is hidden in timers.
Timers
This mechanism allows to measure particular parts of code by integrating timers in you code by means of a set of functions provided by PHP extension. Moreover you can tag timers with special marks which are called, as you may guessed, tags. They are used to group timers information in tag reports.
Each timer consists of:
- float value - time between timer start and stop
- int hit_count - number of timer starts
- array of tags
To use timers you’ll basically need only two functions pinba_timer_start and pinba_timer_stop. Let’s look at the example:
<?php

$timer = pinba_timer_start(array(
    "server" => "ap1",
    "operation" => "concatenate"
));
$result = '';
for ($i = 0; $i <= 10; $i++) {
    $result .= (string)$i;
}
pinba_timer_stop($timer);
After running this script you’ll have some data in tags tables: tag table stores all tags used, timertag stores tag values.
select * from tag;
+----+-----------+
| id | name      |
+----+-----------+
|  0 | operation |
|  1 | server    |
+----+-----------+

select * from timertag;
+----------+--------+-------------+
| timer_id | tag_id | value       |
+----------+--------+-------------+
|        0 |      0 | concatenate |
|        0 |      1 | ap1         |
+----------+--------+-------------+
Having these tags you can count how often each operations runs on each server. To be honest this is quite useless example but I hope you got the idea.
Conclusion
Short theses:
- UPD doesn’t affect application performance
- raw data access
- basic reports
- grouping by tags
Here I described the process of installation of the PHP extension but Pinba engine API allows using any other languages and there already clients for Python, Ruby and Node.js.